GIS in the Wild
So let’s say a big box retailer is expanding. Their previous stores have all been near interstates in relatively rural areas, and typically function as something of a “destination” — the kind of place that is the centerpiece of a day’s errands. Now, this retailer is making its first moves into more densely populated areas; they’ve identified what markets should be targeted based on the demographics and proximity to the existing supply chain.
Within a new city into which they plan to expand, they’ve identified two potential locations:
- Location #1 is located just north of the population center, close to an interstate highway and very close to a large concentration of their core customer… but, it’s part of a larger development in a very desirable area, so the land is very expensive.
- Location #2 is west of the population center, and near a major interstate interchange… yet roughly a 40-minute drive from the pocket of core customers to the north. It’s a stand alone piece of land, and is considerably cheaper than Location #1.
Since it’s always easier to default to price, and that’s typically what the retailer does, let’s go ahead and assume that’s what they do here. Even though Location #2 is further from the target customers, people routinely drive up to three hours to the retailer’s other stores, so by their standard data set, a 40-minute drive versus a 15-minute drive isn’t a huge gap. The stores are built to be destinations, after all.
So, Location #2 wins!
The retailer pours money into building a gigantic destination store, as is their typical M.O. The store opens and performs very well for its first year — in fact, it’s one of the top performing stores in the company. Meanwhile, their top competitor sees the success, and opens a store of their own in the same market: they have the same data and a similar institutional experience as our example retailer, so for them, they see a chance to poach some customers and create a healthy competition for the market share.
They, however, choose Location #1, and open a smaller-scale operation than their destination stores. And if you’ve paid attention to the expansion & contraction of major, big-box retailers in the last decade, you might know where this is going from personal experience.
Fast forward one year: the first store opened, at Location #2, is now one of the worst performing stores in the company, with massive overhead because they built a gigantic store to attract people from hundreds of miles.
Meanwhile, the competitor’s store at Location #1 is doing great — one of the top performers.
The competitor at Location #1 successfully out-positioned our retailer because, through GIS consulting and map analytics, they understood that people move through urban areas very differently than they do rural ones — in cities, 40 minutes might as well be two days for all the consumer cares. If you can find it quicker, you’ll take it.
The store at Location #2 not only lost the war, they lost the battle itself. And they lost it before it even began, because they had poor planning, based on poor, improperly researched assumptions.
The competitor won the Location Wars (a new series coming this Fall to Bravo!, we hope) knew they had to pay more money upfront to be properly positioned as close as possible to their core demographics. They created an intervening opportunity for the people most likely to be purchasing the products both stores sold. Sensing their success and a chance for a stranglehold on the market, the Location #1 retailer quickly opens another location just south of the city center — also ~15 minutes away — creating another opportunity for those customers, effectively controlling two thirds of the market and strangling the first-to-market retailer.
Now, we all love a good bedtime story… but, what’s the moral?
Ignoring the geographic realities of your chosen market — especially if it’s just to save on the upfront investment — can and does have disastrous effects on your bottom line, even many years after the initial decision. You can hand your competitors an advantage you should have had.
The Map Nerd is your secret weapon for advertising targeting, site selection, direct mail consulting, and customer mapping: ensuring that your market stays your market.
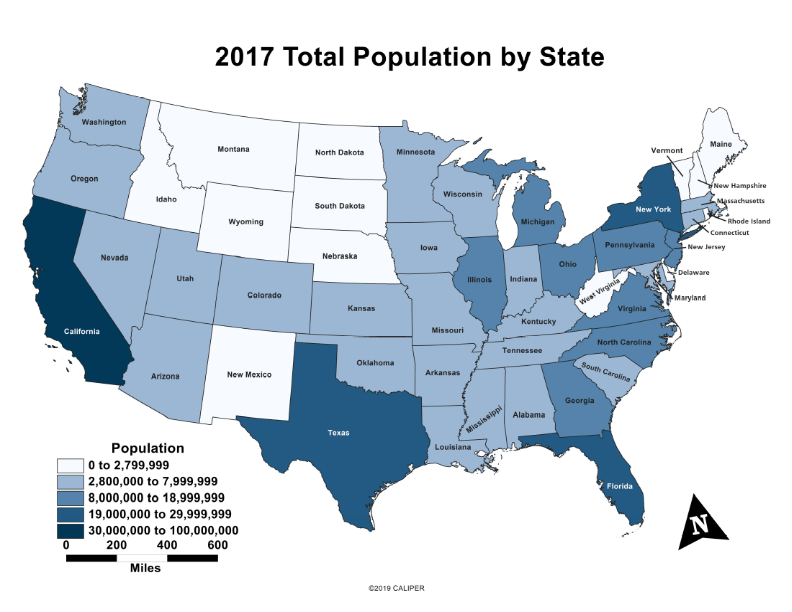
| State | 2017 Population | State | 2017 Population |
| california | 38,982,847 | Kentucky | 4,424,376 |
| Texas | 27,419,612 | Oregon | 4,025,127 |
| Florida | 20,278,447 | oklahoma | 3,896,251 |
| New York | 19,798,228 | Connecticut | 3,594,478 |
| Illinois | 12,854,526 | Lowa | 3,118,102 |
| pennsylvania | 12,790,505 | Utah | 2,993,941 |
| ohio | 11,609,756 | Mississippi | 2,986,220 |
| Georgia | 10,201,635 | Arkansas | 2,977,944 |
| North Carolina | 10,052,564 | Kansas | 2,903,820 |
| Michigan | 9,925,568 | Nevada | 2,887,725 |
| New jersey | 8,960,161 | New Mexico | 2,084,282 |
| Virginia | 8,365,952 | Nebraska | 1,893,921 |
| Washington | 7,169,967 | West Virginia | 1,836,843 |
| Arizona | 6,809,946 | Idaho | 1,657,375 |
| Massachusetts | 6,789,319 | New Hampshire | 1,331,848 |
| Indiana | 6,614,418 | Maine | 1,330,158 |
| Tennessee | 6,597,381 | Rhode Island | 1,056,138 |
| Missouri | 6,075,300 | Montana | 1,029,862 |
| Maryland | 5,996,079 | Delaware | 943,732 |
| Wisconsin | 5,763,217 | South Dakota | 855,444 |
| Minnesota | 5,490,726 | North Dakota | 745,475 |
| Colorado | 5,436,519 | District of Columbia | 672,391 |
| South Carolina | 4,893,444 | Vermont | 624,636 |
| Alabama | 4,850,771 | Wyoming | 583,200 |
| Louisiana | 4,663,461 |
